
Avoid these common mistakes while applying for financial aid.
So, when it comes to paying for college, which states are seeking the most scholarship opportunities? And how many students are actually submitting scholarship applications? To determine the amount of scholarship applications submitted per student per state, a sampling of nearly 2 million registered users was derived from ScholarshipOwl’s internal database.
State Contribution to Total Scholarship Applications Submitted
The students seeking the most scholarships hail from Texas. Nearly 11% of all scholarship application submitted in the united states came from the Lone Star State. Next, are students residing in California, followed by Florida residents with approximately 10% and 7% of total applications submitted across the U.S, respectively. New York ranks fourth (4.5%) and Georgia fifth (3.9%). The state in which its students submitted the least amount of scholarship applications is Vermont. D.C. follows marginally close but places second to last. The map below shows how much each state contributes to the total amount of scholarship applications submitted.
Win more scholarships with less effort
Simplify and focus your application process with the one-stop platform for vetted scholarships.
Check for scholarships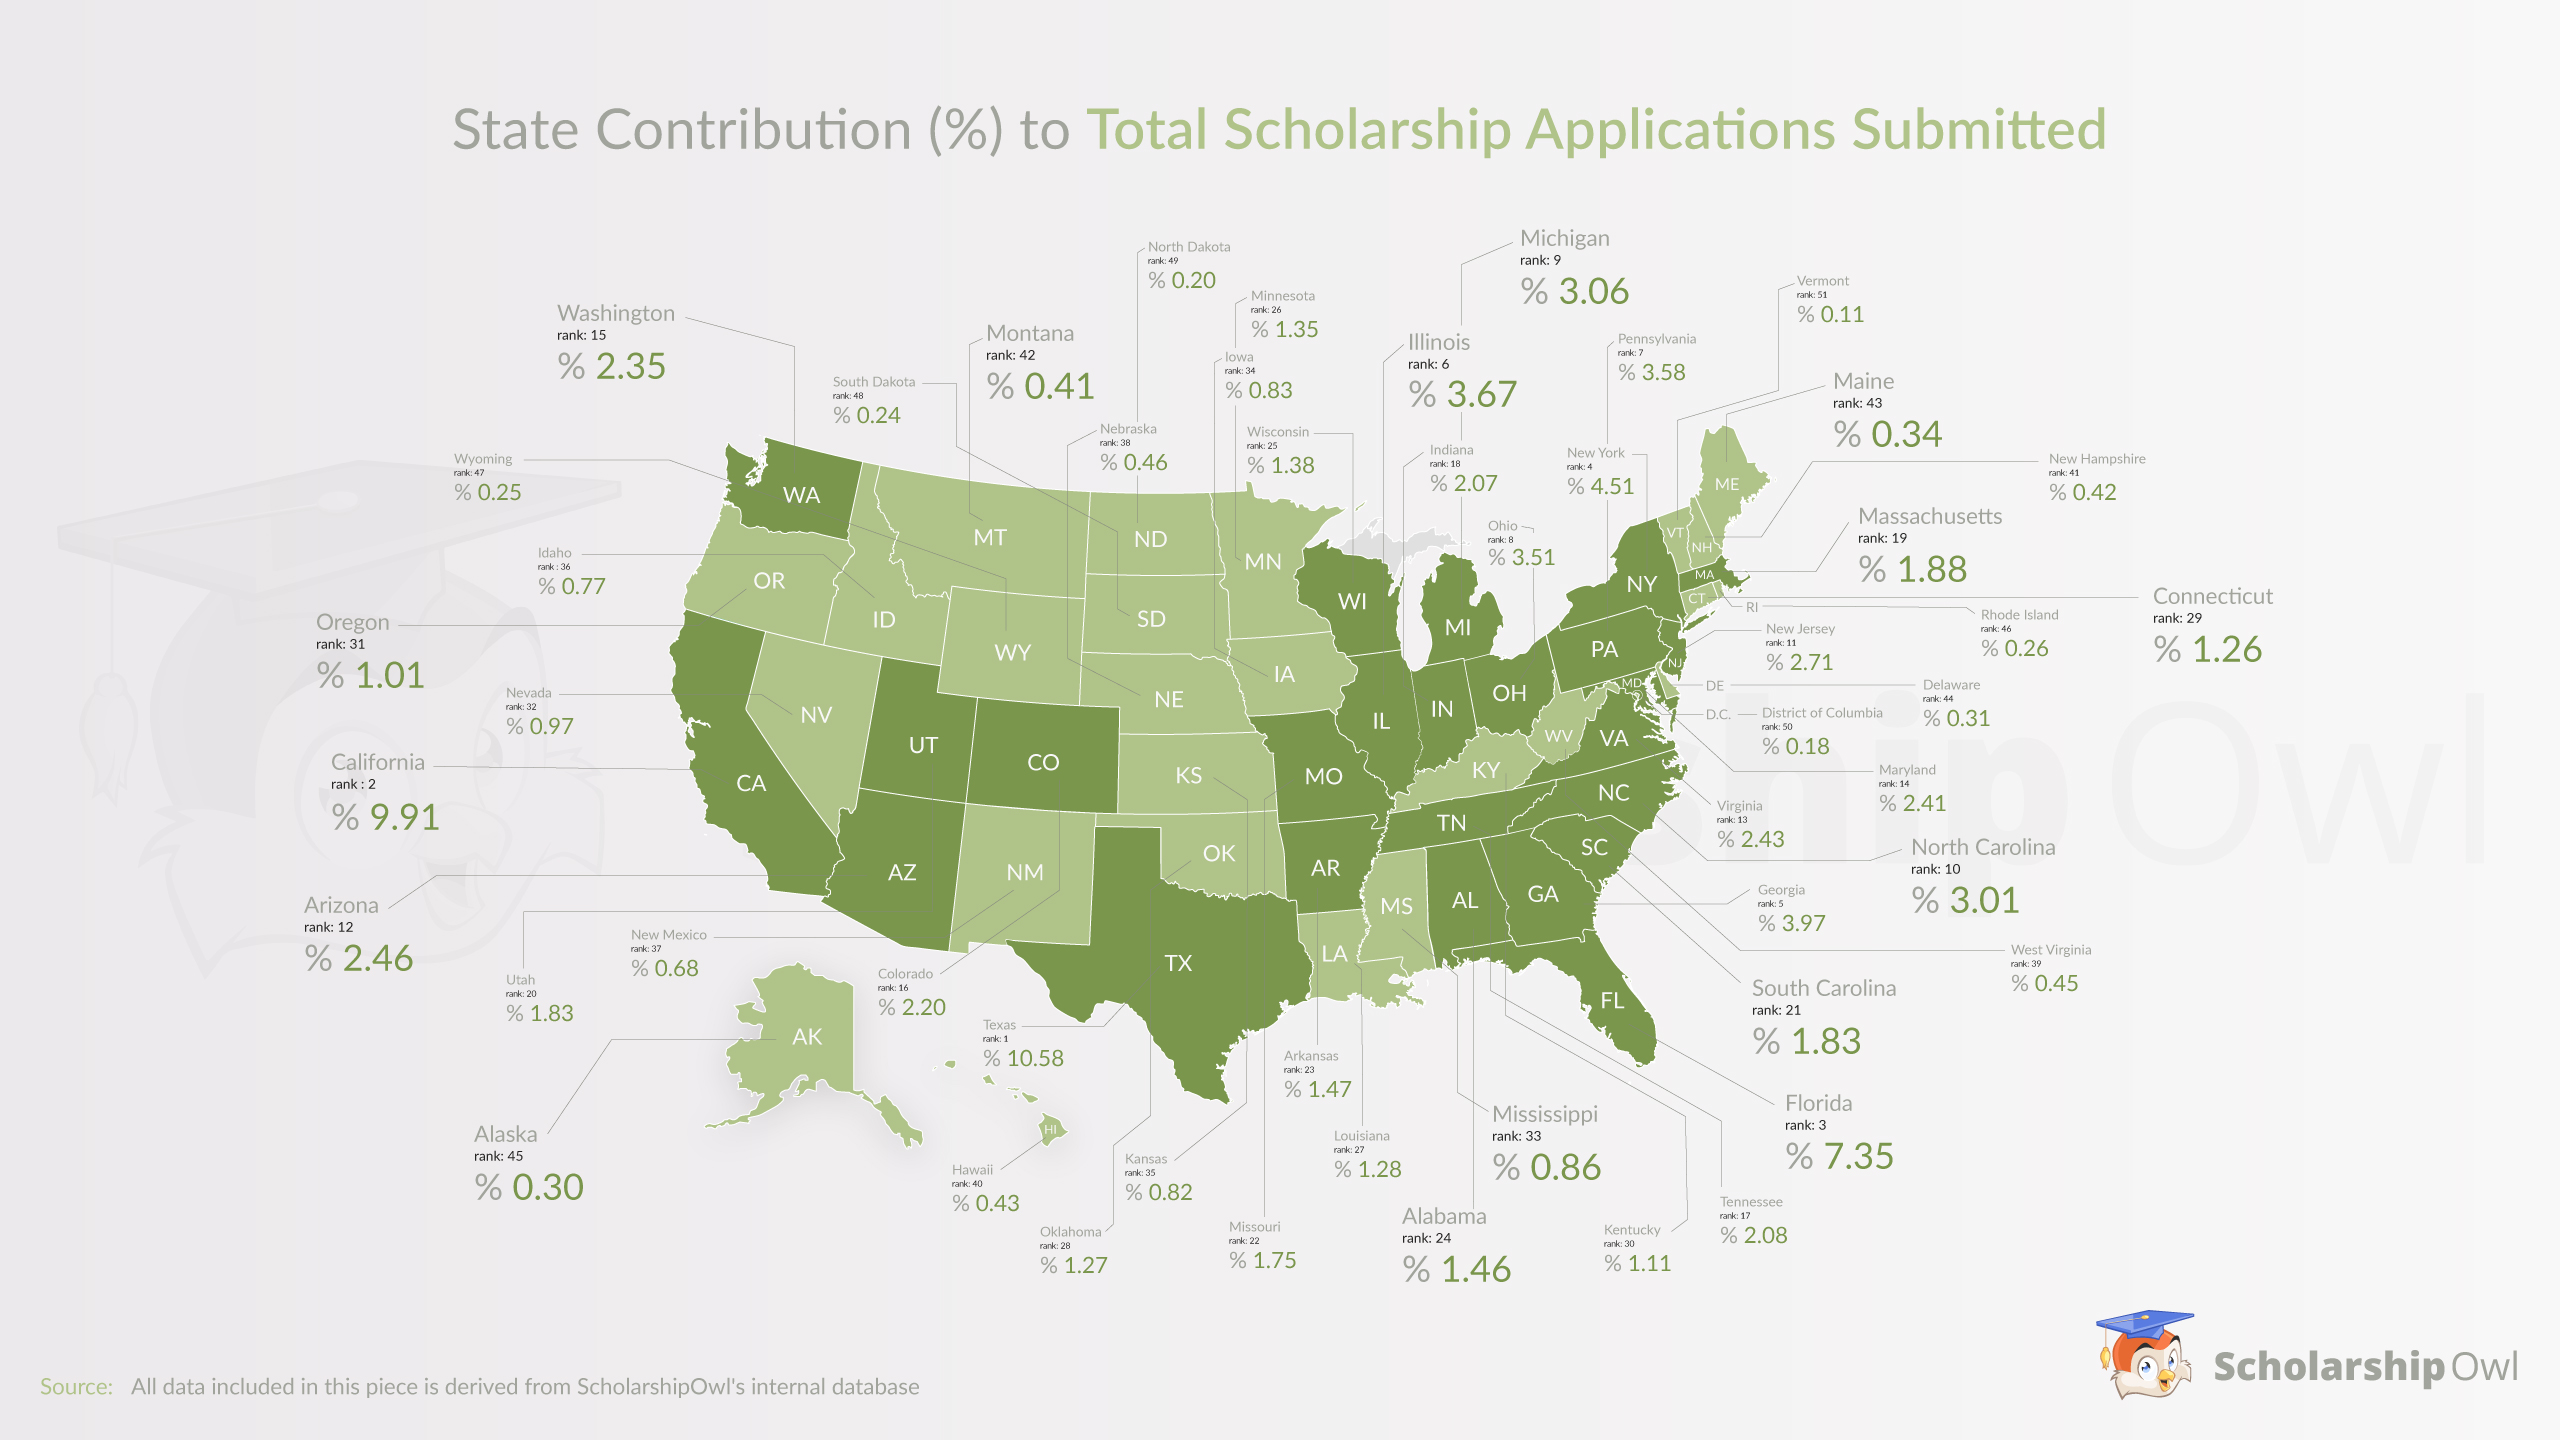
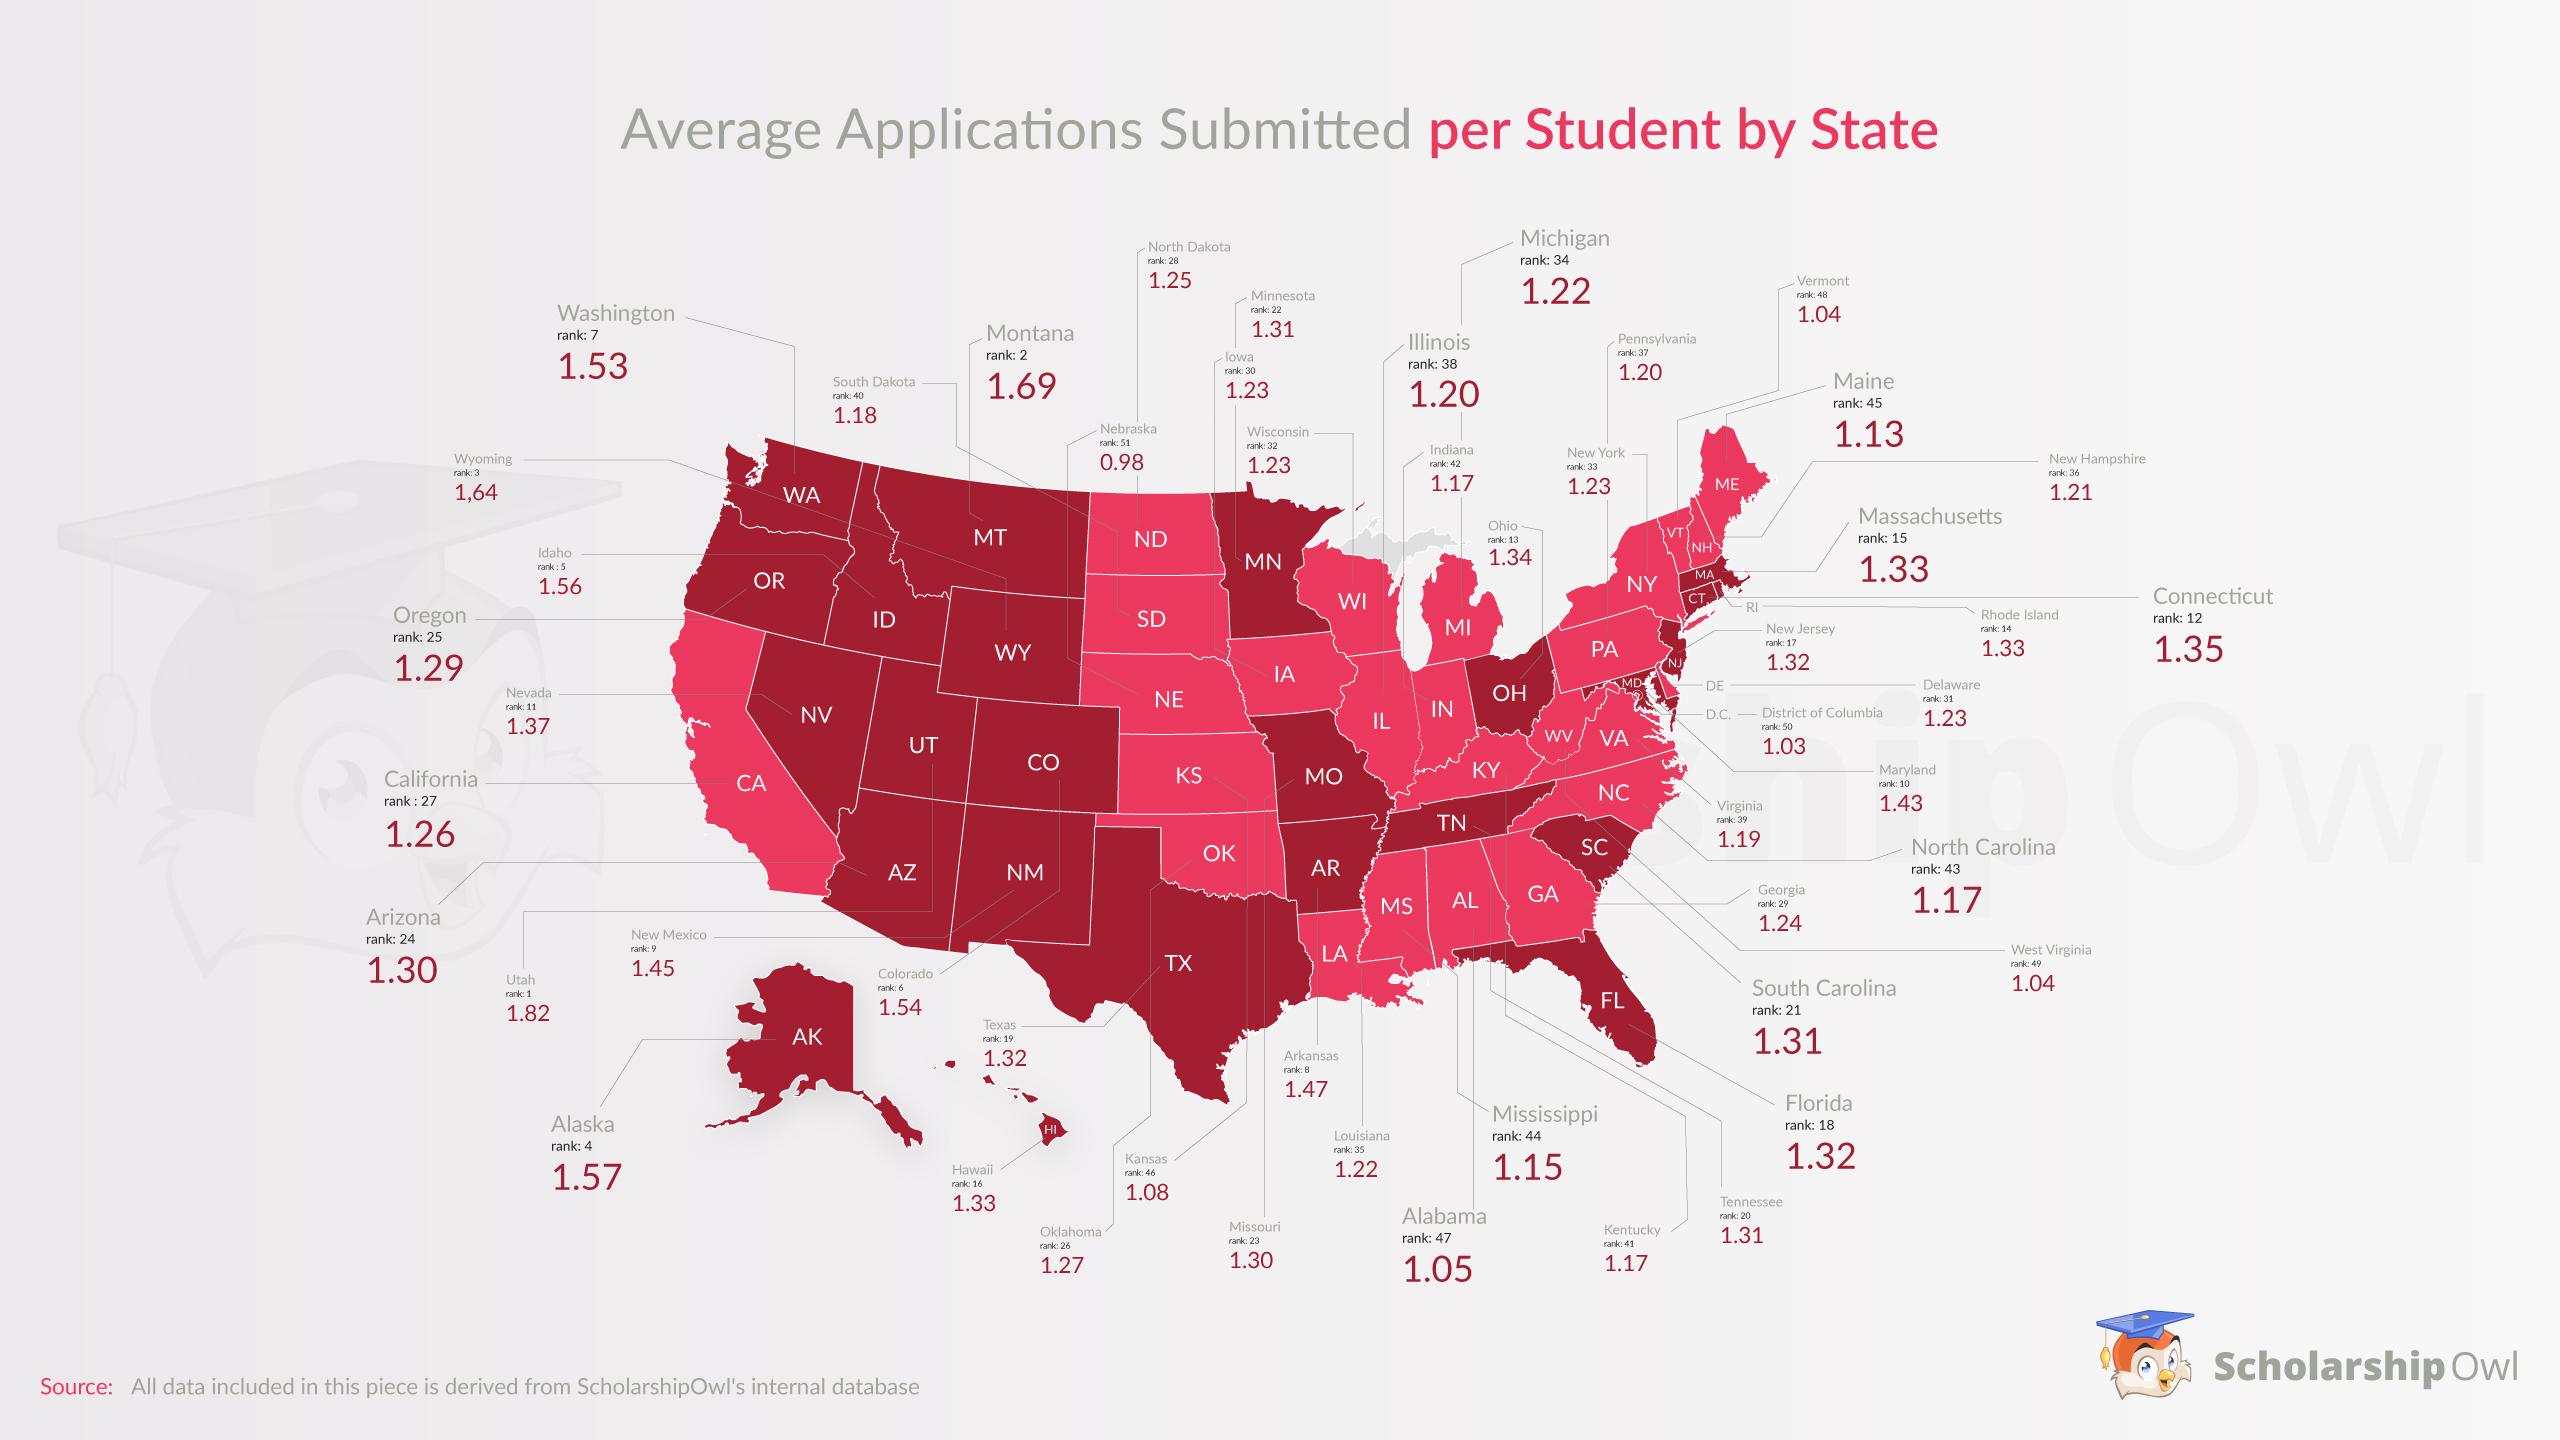
Average Application Submitted per Student by State
Although Texas contributed most to overall scholarship applications submitted per sate, it did not submit the most application per capita. Students residing in Utah submitted an average of nearly 2 applications submitted per student. Moreover, Montana and Wyoming follow closely and rank second and third, respectively. Followed by Alaska in fourth, and Idaho in fifth. Meanwhile, Nebraska ranked at the bottom with the average applications submitted per student just shy of 1. Once again, D.C. comes marginally close to ranking last, but ranks second to last instead. The map below depicts the total average of application submitted per state, per capita.